Description
This website is demonstration of live API using HTML5 and JavaScript.
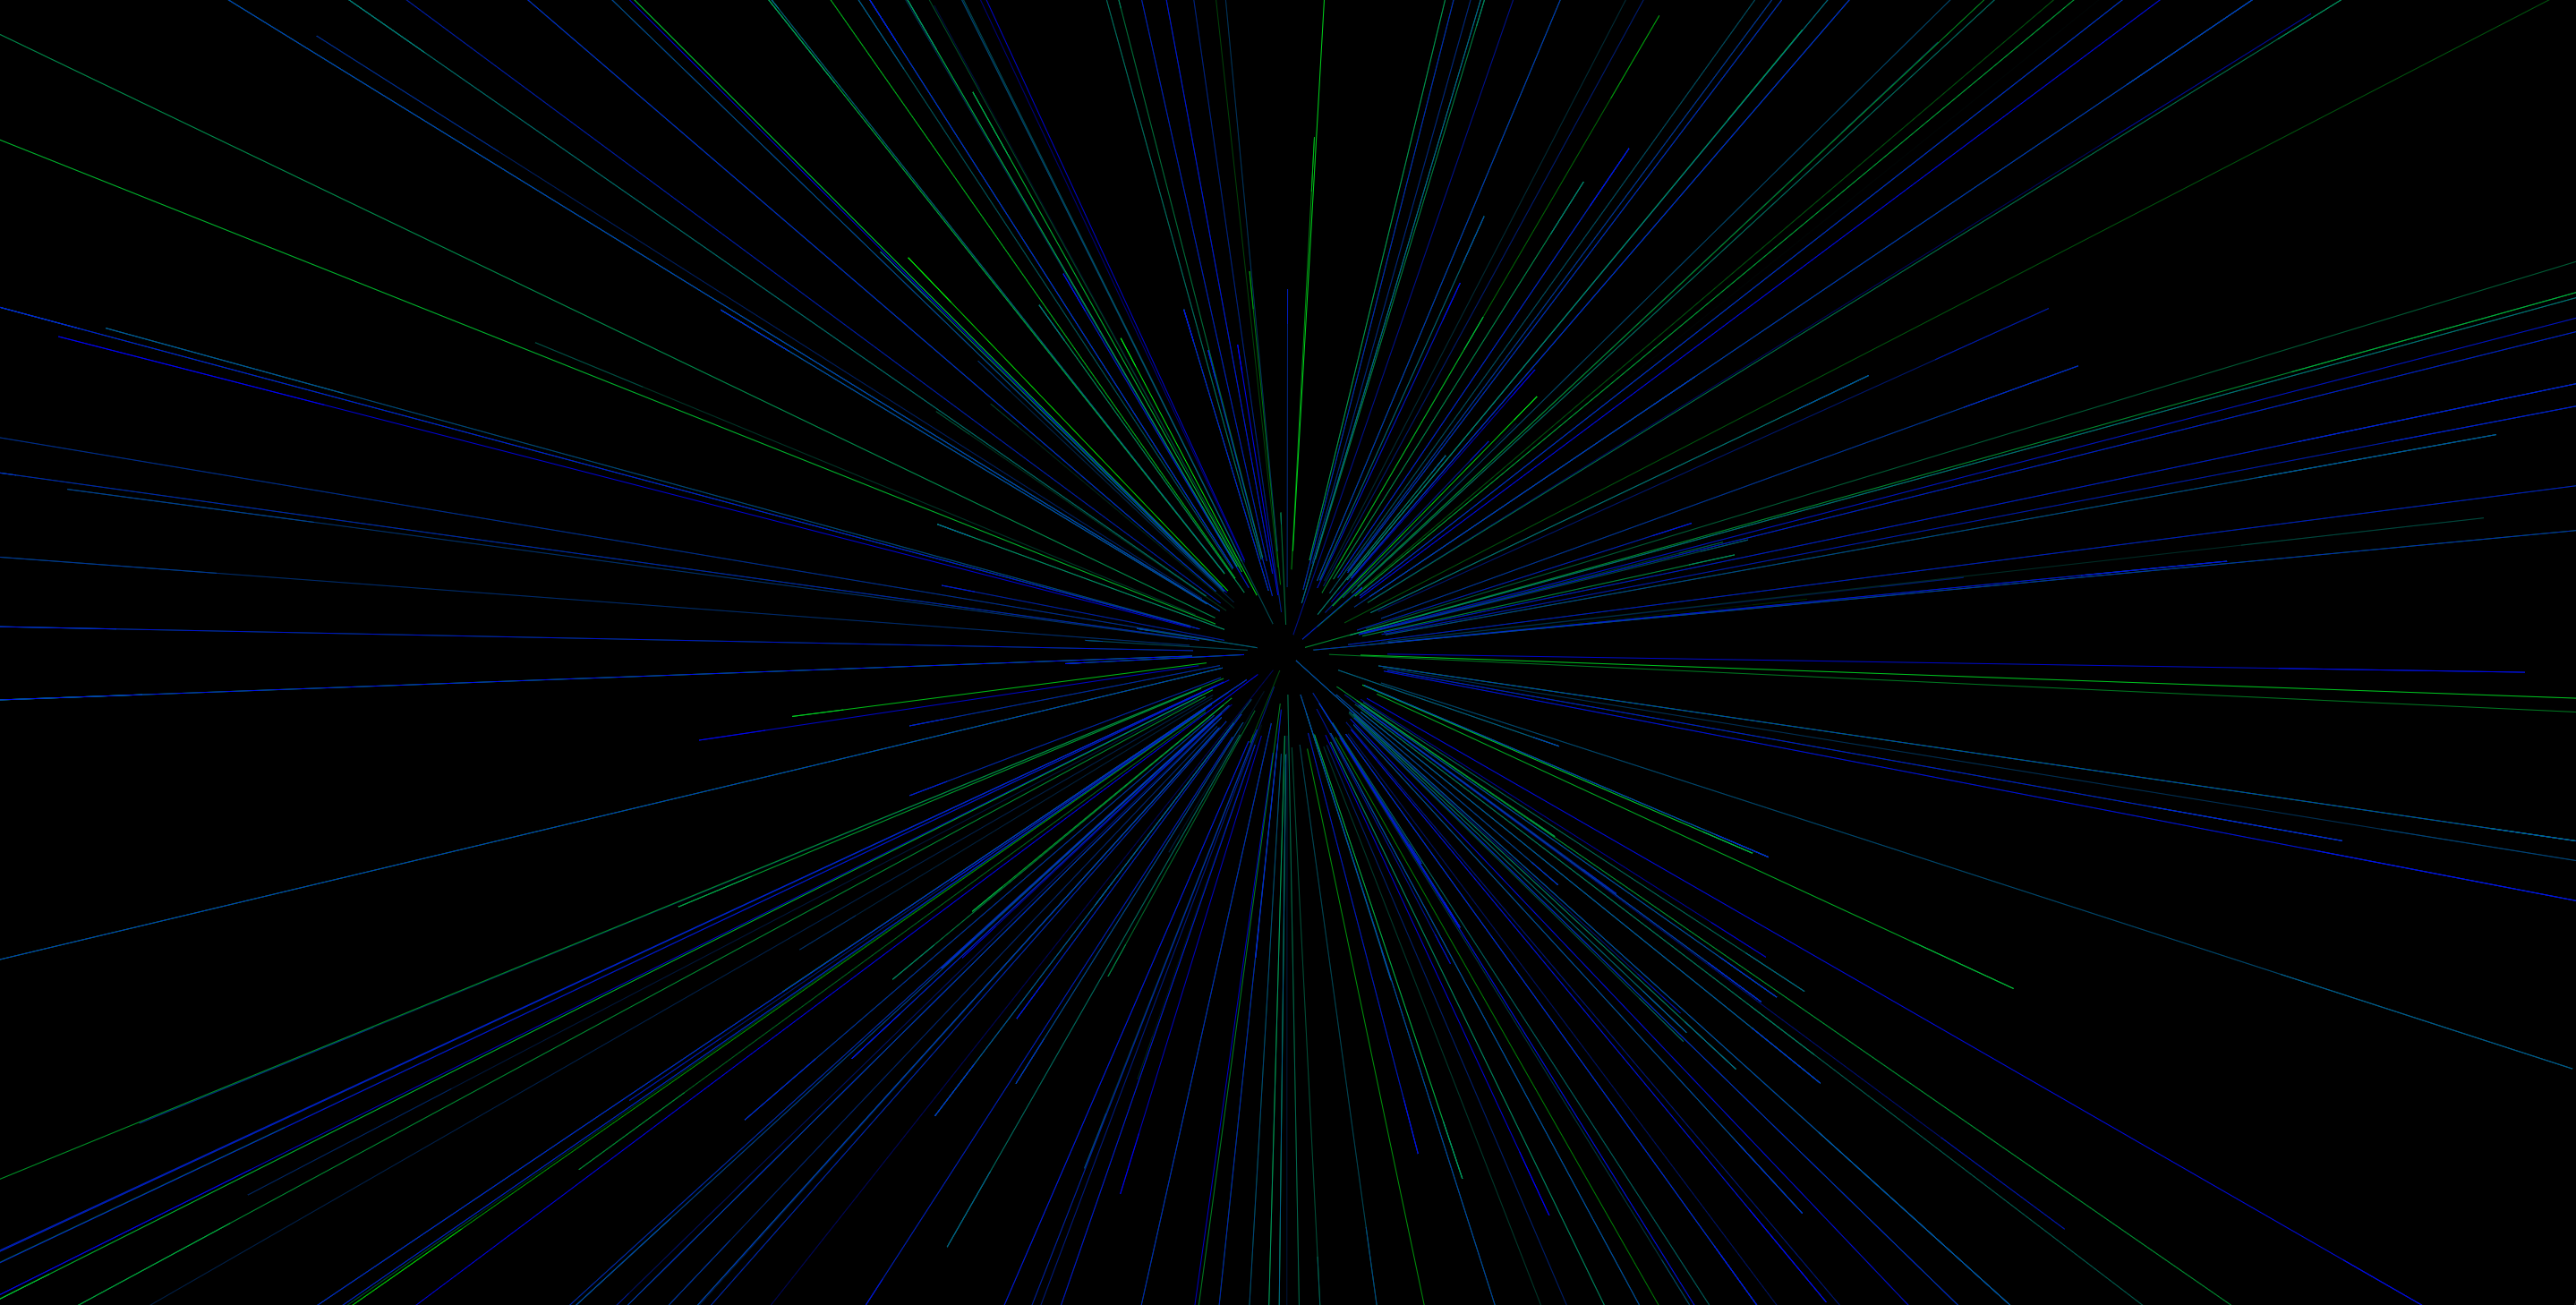
I have used a live API to visualize it on a web-page. Two components used are Moisture contents in the air. three.JS is one of JavaScript frameworks used to display the components. There are two lines on a sphere which display the API on green vertical lines and blue vertical lines. Second display is with the help of google graphs, where two components are displayed on y axis in blue and red.
Project Description
Source data source - https://data.sparkfun.com/streams/xRpV3GA0jVHMnoOnor2K Libraries libraries used - https://www.gstatic.com/charts/loader.js jquery-3.1.0.min.js - https://jquery.com/ this was used for bar graph.html file. three.js - http://threejs.org/ Projector.js - http://threejs.org/ CanvasRenderer.js - http://threejs.org/ these were used for Sphere.html file Project demo https://rawgit.com/abhisheksuhasmhatre/Project-1/master/bar%20graph.html (links for visualization - for graph) https://rawgit.com/abhisheksuhasmhatre/Project-1/master/Sphere.html (for sphere) References (https://developers.google.com/chart/interactive/docs/gallery) area chart (http://threejs.org/examples/canvas_lines_sphere.html)

